Difference between revisions of "NCAA Tournament Simulated Using Accounting Research Rankings"
| Line 1: | Line 1: | ||
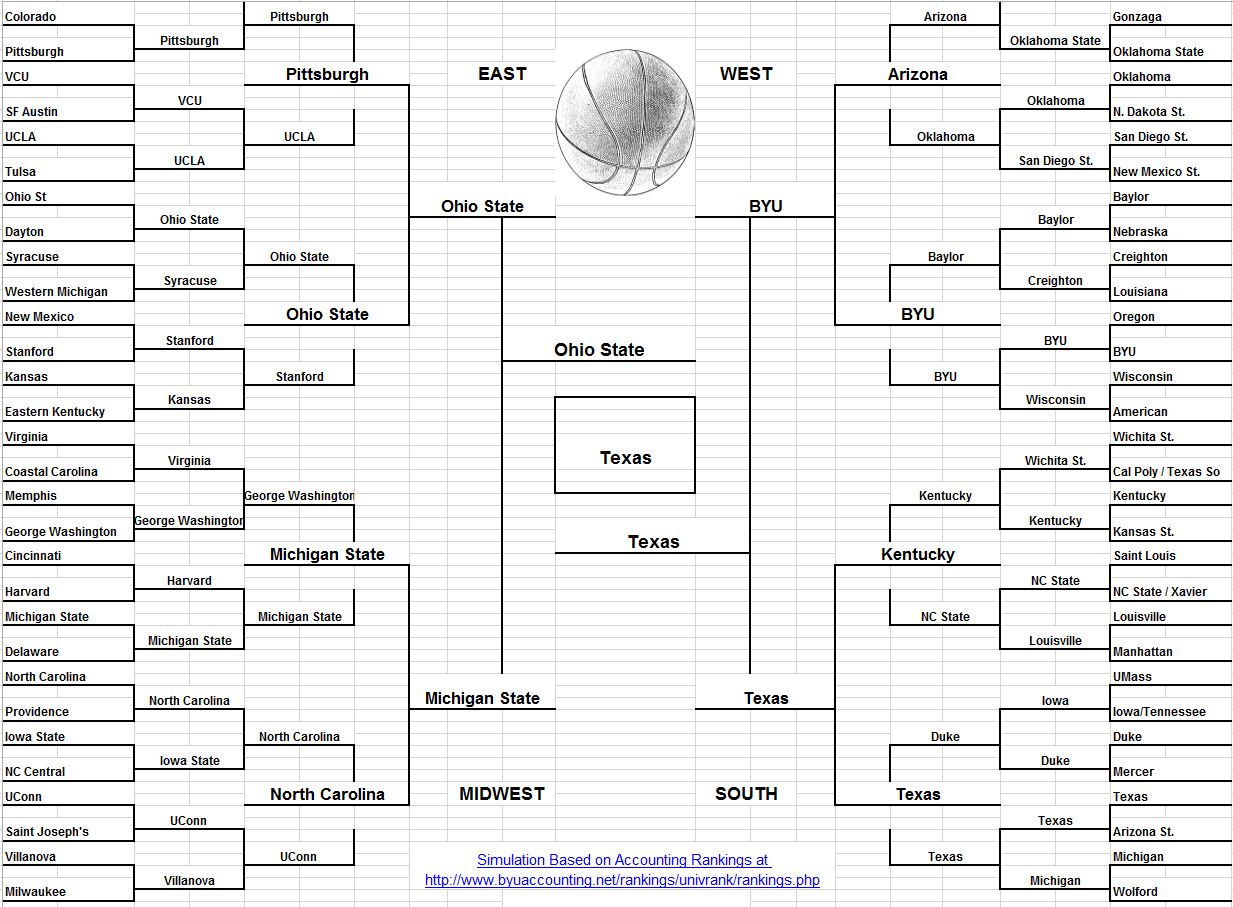
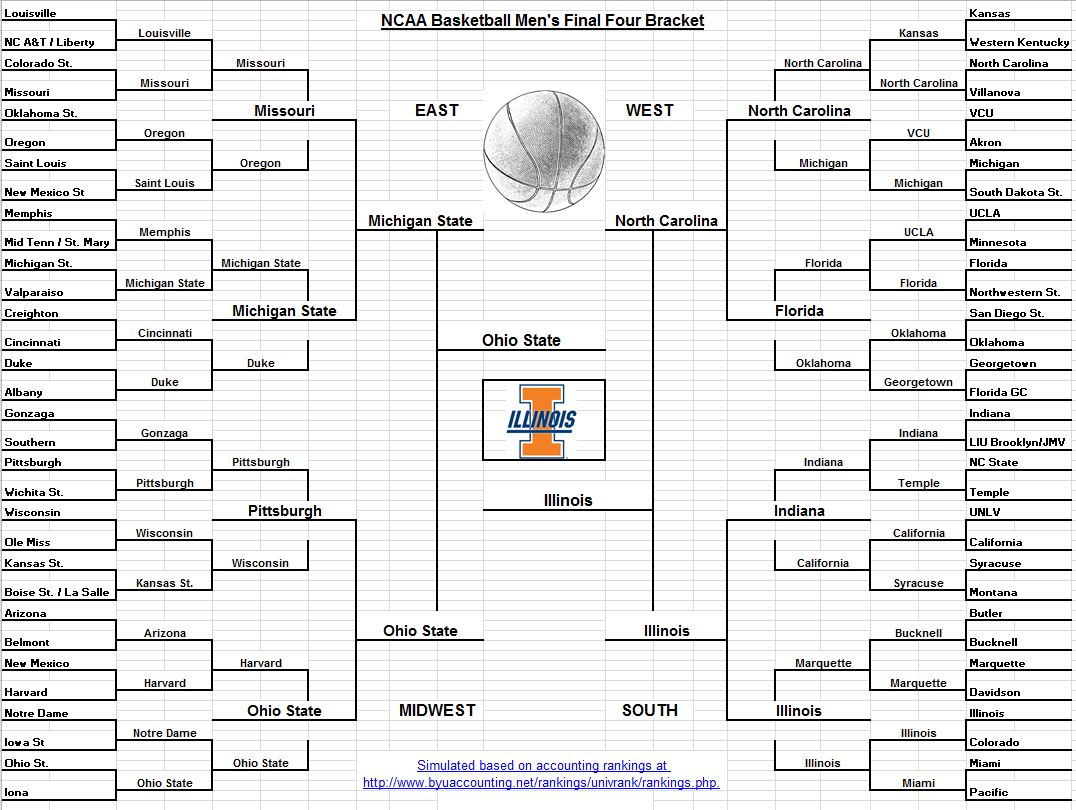
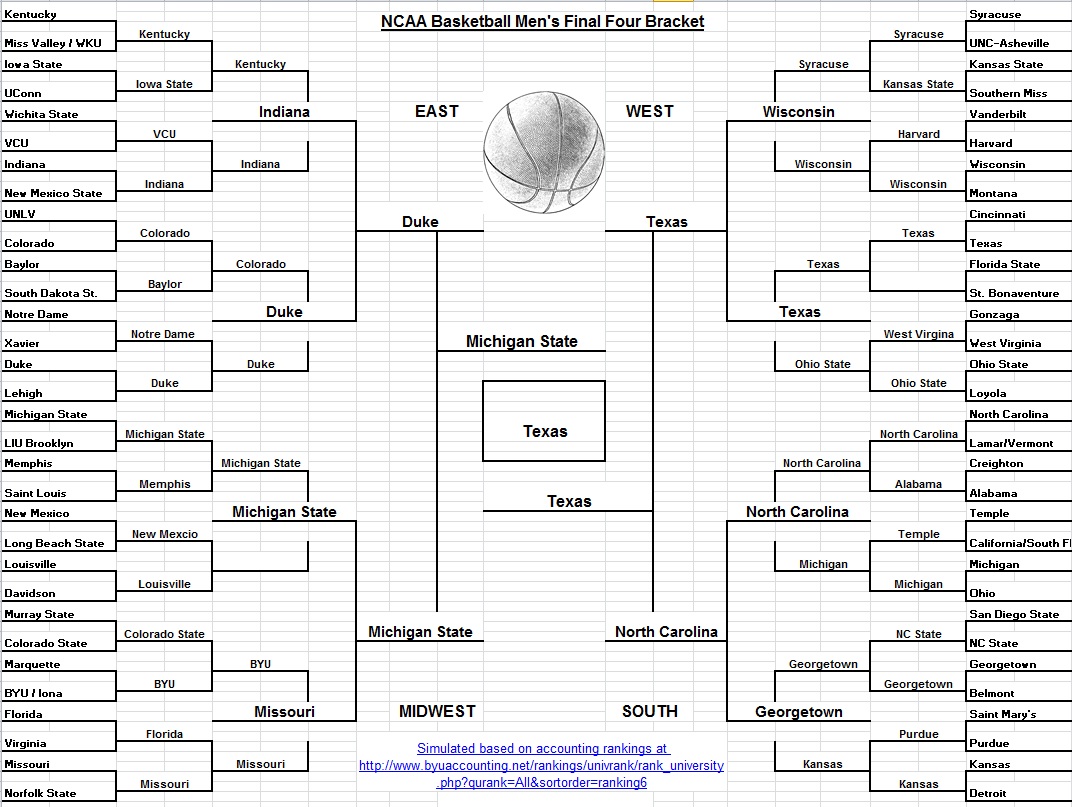
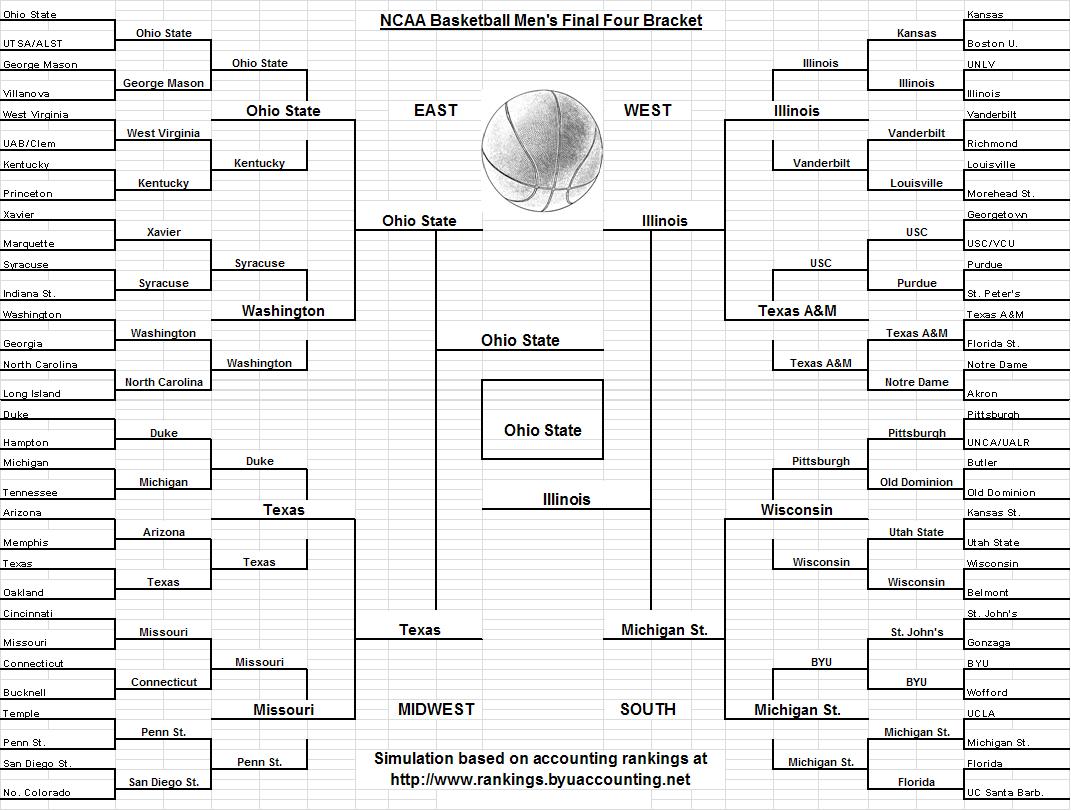
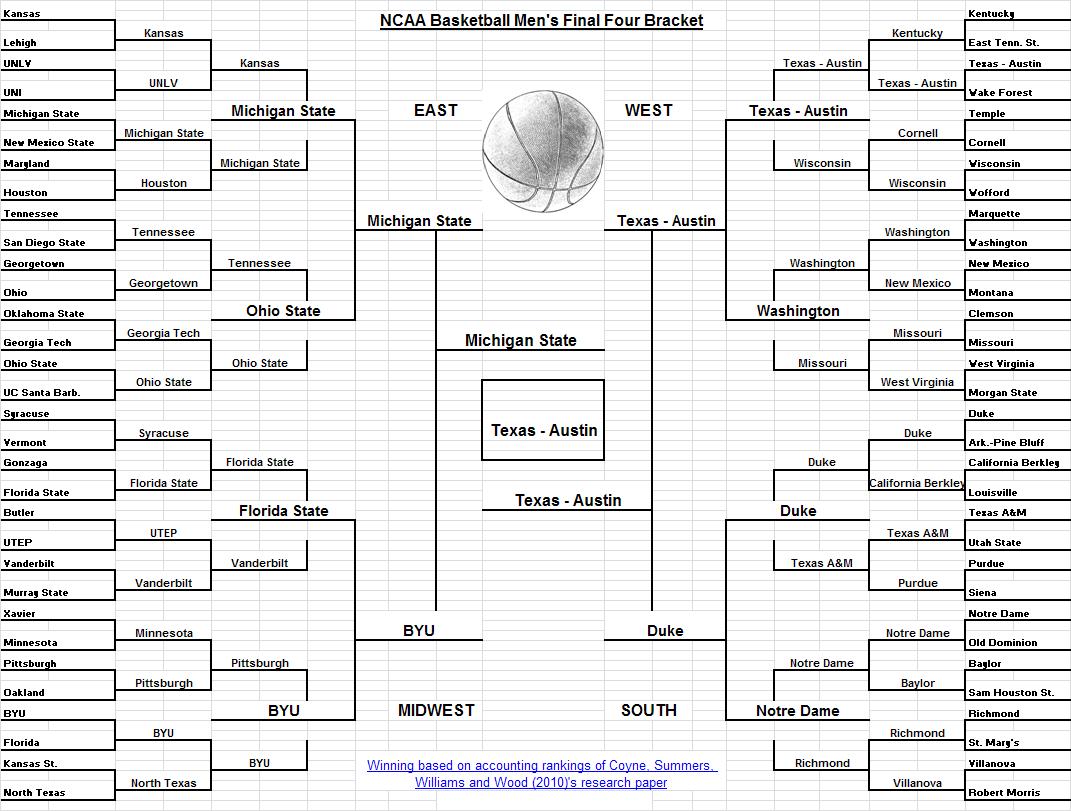
This is what the NCAA Division I Men's Basketball Championship would look like if the winner of each game was the program with the most productive accounting researchers over the last 6 years (i.e., the faculty that has produced the most journal articles in the journals included in the study). For complete [http://www.byuaccounting.net/rankings/ accounting rankings] visit the companion website (rankings include [http://www.byuaccounting.net/rankings/ University Accounting Rankings] and [http://www.byuaccounting.net/rankings/phdrank/phdrankings.php Ph.D. accounting rankings]). | This is what the NCAA Division I Men's Basketball Championship would look like if the winner of each game was the program with the most productive accounting researchers over the last 6 years (i.e., the faculty that has produced the most journal articles in the journals included in the study). For complete [http://www.byuaccounting.net/rankings/ accounting rankings] visit the companion website (rankings include [http://www.byuaccounting.net/rankings/ University Accounting Rankings] and [http://www.byuaccounting.net/rankings/phdrank/phdrankings.php Ph.D. accounting rankings]). | ||
| + | |||
| + | ==2014 Simulated Results== | ||
| + | [[Image:NCAA2014.JPG]] | ||
==2013 Simulated Results== | ==2013 Simulated Results== | ||
Revision as of 07:43, 17 March 2014
This is what the NCAA Division I Men's Basketball Championship would look like if the winner of each game was the program with the most productive accounting researchers over the last 6 years (i.e., the faculty that has produced the most journal articles in the journals included in the study). For complete accounting rankings visit the companion website (rankings include University Accounting Rankings and Ph.D. accounting rankings).
Contents
2014 Simulated Results
2013 Simulated Results
2012 Simulated Results
2011 Simulated Results
